About
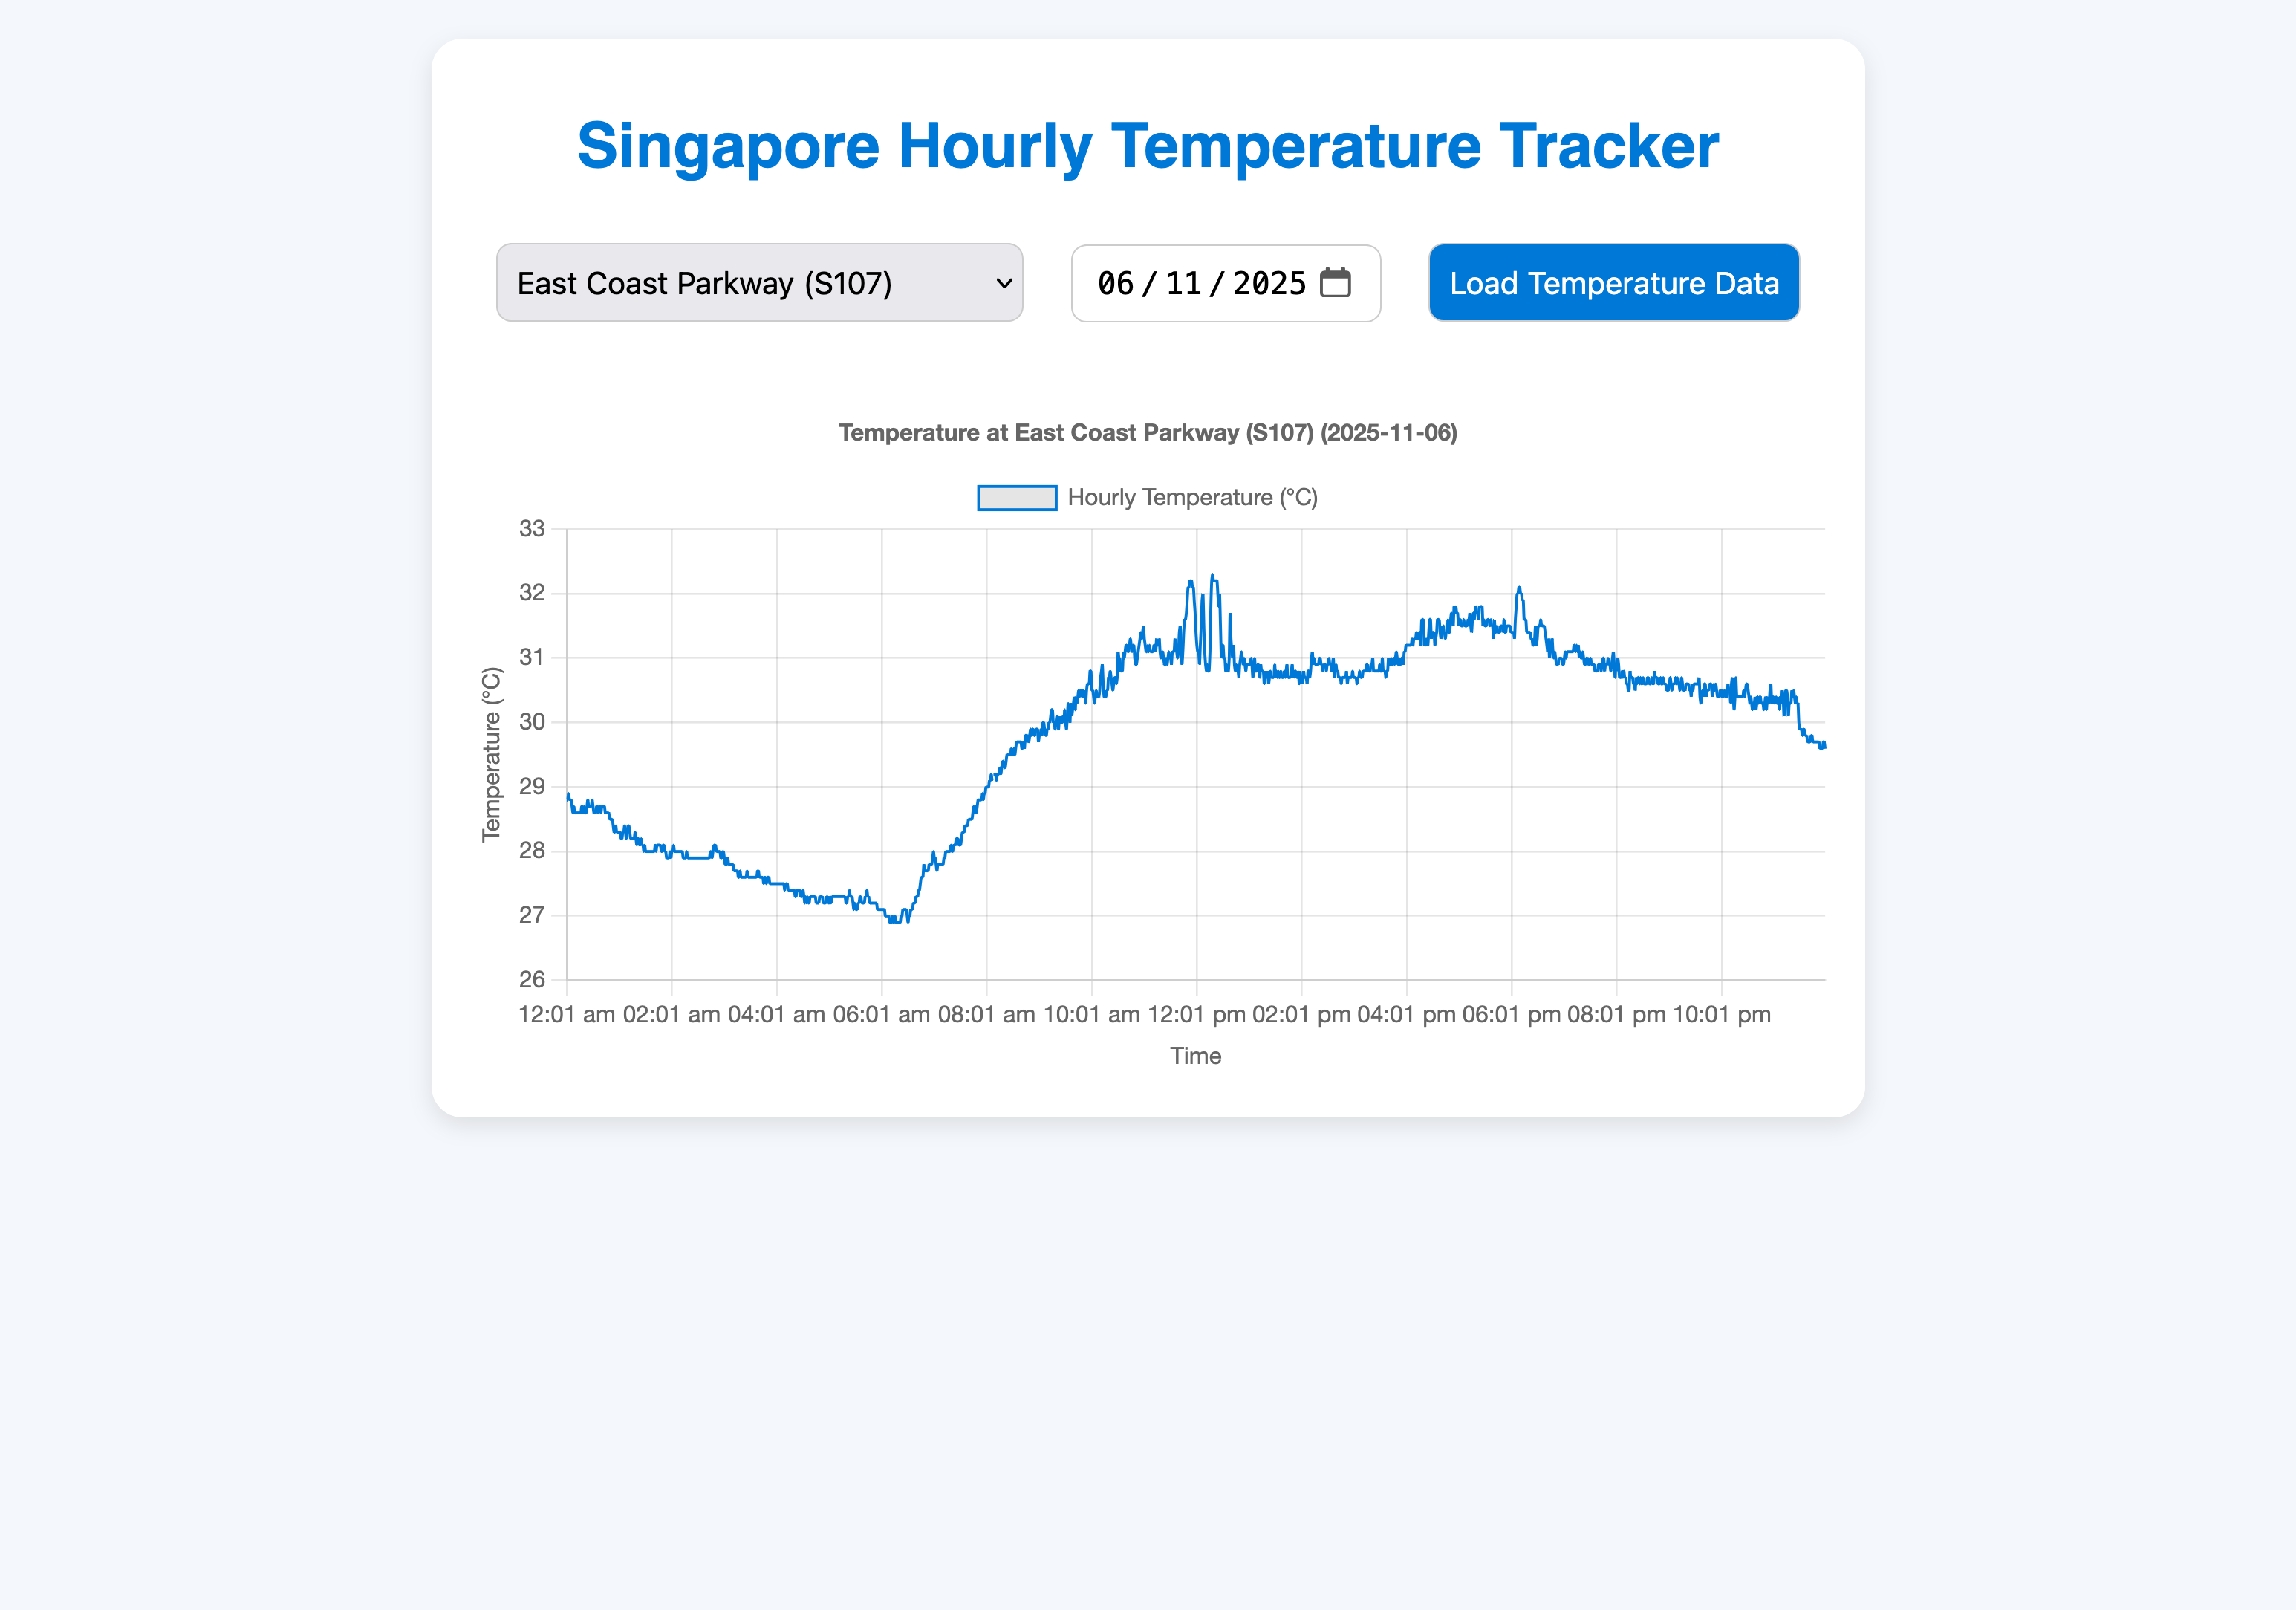
A graph that shows the history of daily temperature with a 5 minute interval in Singapore from as early as 2017. It is built in HTML, CSS and JavaScript. The user is able to select a data point(location) as stated in the API and select a date. The user will be able to view the graph after entering the details.
Tech Used
- HTML
- CSS
- JavaScript
- Fetch function
- Chart.js
- Asynchronous Functions
- DOM Manipulation
- getElementById()
- createElement()
- Date object
- addEventListener()
- windows.onload
- .map()
- Decimation
- Await
- .then() and catch()
Development History
- Gathered all the requirements for the website such as API and design flow.
- Asked ChatGPT to help with the chart.js code.
- Removed and fixed buggy stuff by AI.
Potential implementations
- Introduce Next.js to the website to enable full server-side functionality and databases.
- Reduce the fetching of API by storing in databases and retrieving the data when queried repeatedly.
- To protect the API and potentially use a private API with higher rate limits.